


– Use as a Comparison tool;
– Use as an Analytical tool:-
– Shareholders, Management, Industry analysts;
– Use in Investment decisions:-
– Investors, Banks, Equity brokers;
– Identification of high- and low-cost producing regions, informs company decisions on where
to invest;
– Provide a trend in costs as the mine mature; and
– Determine commodity price in times of market oversupply.
The cost curves are displayed here per ounce recovered and per milled tonne. Every company applies its own exchange rate when reporting costs over periods. The average exchange rate in 2016 was ZAR/USD 14.72. The aim on any operation should be to remain within the lower 50th percentile of cost producers to ensure profitability even in market downturns. The principle of this logic is based on economic theory that states that the commodity price is a function of the supply-demand balance of the specific commodity. If demand decreases due to weak market conditions and commodity prices subsequently decline, it is likely that the highest cost producers will suspend production first, which reduces supply and ultimately supports higher commodity prices. (Note: Cash Cost represents the cash cost incurred at each processing stage, from mining through to recoverable metal delivered to market, less net by-product credits (if any). All-in Sustainable Cost is the sum of the cash cost, capital expenditure, indirect costs and net interest charges.)
Cost curves can be constructed and analysed at a company or country level to facilitate comparison on a national, regional, or international level. South African gold mines have the highest total cash costs in the world and are operating at 38% above the average global total cash costs (USD630/oz for 2016).
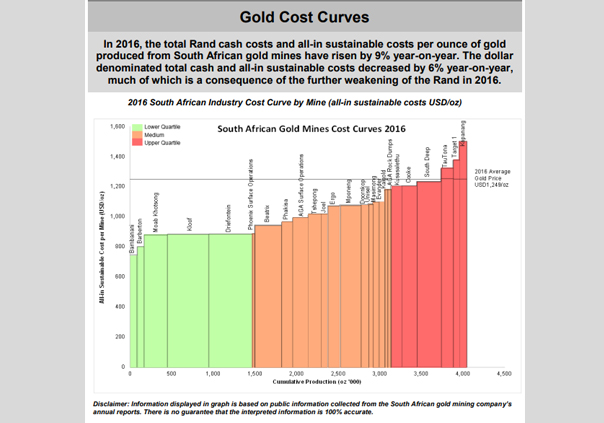
Some of the major reasons for the costs being higher are the age of the operations, thus increasing maintenance costs on the shafts and machinery, as well as the fact that the gold mines in South Africa are by far the deepest in the world. Minxcon used these cost curves to compare the South African operating gold mine’s cost curves against the average gold price for the year. The figure to follow shows the South African gold industry cost curve for 2016 at a mine level. From the figure it can be seen that at the 2016 average gold price of USD1,249/oz, 12% of the gold mines in South Africa were not profitable with all-in-costs above the gold price. These 12% mines accounted for 8% of South Africa’s total ounces of approximately 4 million produced during 2016. Should gold retrace back to the USD1,100/oz level, the costs of 32% of the South African mines will be above the price line on an all-in sustainable cost basis.
With South African cash costs of USD867/oz which is 27% below USD1,100/oz level; 80% of South African mines will be able to sustain operations for a limited period. However, there might be a contraction in exploration and expansion which could lead to upward pressure on the price sooner or later as most mines are geared sustaining operations but are not replacing resources. Significant production from new mines would realistically not take hold for approximately five to ten years because of the lead times on starting up operations. In the case of existing South African operations with old infrastructure, constant replacement is required and older mines will come under immense pressure at lower price levels.

